")
")
Emissions from semi-arid areas
The most recent activities were driven by the concern to better describe the natural and anthropogenic emissions in semi-arid zones, areas where these emissions should evolve strongly in the future due to the combined effects of climate change and the increasing use of land for agricultural purposes.
Specific attention has therefore been brought to developments of specific parameterizations to describe the erosion flux on agricultural surfaces [Kardous et al., 2005 and b] or non-homogeneous vegetated surfaces [Bowker et al., 2007]. Moreover, the frequent presence of seasonal vegetation, linked to the existence of a well-marked rainy season, requires implementation of specific modeling approaches in order to reproduce changes on the properties of surface (roughness, coverage percentage) linked to the dynamic of the vegetation.
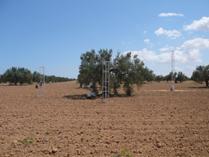 |
FIG - View of a field of plowed olive-tree instrumented to measure the dynamic conditions and erosion fluxes in the south of Tunisia (Zarzis). Dynamic conditions are recorded at different points from the position of olive trees to describe the complexity of the flow around these obstacles and impacts on erosion (thesis Mr. Labiadh, al. Institute of arid regions, Medenine, Tunisia).
|
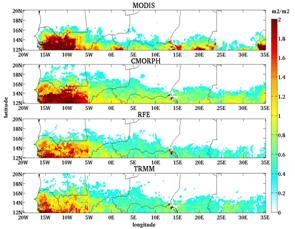
In the Sahel, such dynamic modeling of steppe vegetation was conducted using an adapted version of the model STEP (Mougin et al., 1995). The characteristics of simulated vegetation were validated and converted to surface roughness [Pierre et al., 2011]. Dust emissions then could be simulated by taking into account the effects of inhibition of emissions related both to the moisture of the soil and seasonal herbaceous vegetation [Pierre, 2010; Pierre et al., submitted].
|
FIG - Comparison of simulated vegetation with the model STEP (al. LMTG, Toulouse with the leaf vegetation indices (Leaf Area Index, LAI) of the MODIS (Moderate Resolution Imaging Spectroradiometer) on the Sahel zone instrument). Three different simulations are carried out using as input data the precipitation fields from three different satellite products (CMORPH, RFE, and TRMM). The figures present measured and simulated vegetation at their maximum during the rainy season of 2004 (Pierre et al, 2010). |