")
")
Simulation of dust emissions in arid zones
The application of the emission model in arid desert areas at regional or continental scales requires documenting the surface properties of interest for wind erosion. To do this, the LISA initially developed a method of mapping of surface roughness and soil types based on a geomorphological approach [Marticorena and al., 1997; Callot et al., 2001]. The possibilities of using surface products derived from satellite observations have also been explored and led to the development of methods for mapping of surface roughness from reflectance surface data (BRDF Polder) or from coefficients of backscatter data radar [Marticorena et al., 2004; Marticorena et al., 2006]. These maps helped quantify the emissions of the deserts of Asia [Laurent et al., 2005, 2006, Darmenova et al., 2009] and Sahara [Laurent et al., 2008], and to study the inter-annual variability of their emissions. These data, for the most part unique, are now distributed and used by the community working on the modeling of dust.
This approach need to be extended to other arid regions of the world (Australia, Atacama, Namibia…) in order to provide a database allowing accurate and homogeneous quantification of emissions on a global scale and to assess the relative contribution of the different sources to the global atmospheric content of mineral aerosols.
 |
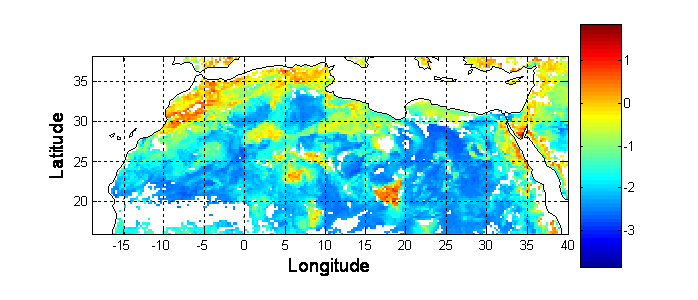 |
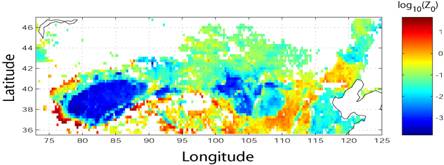
Figure 1: map of aeolian roughness heights derived from products surface POLDER-1 in East Asia (Laurent et al., 2005) and North Africa (Laurent et al., 2008) (coll. LSCE) to estimate the erosion threshold wind velocity. The areas colored in blue show the sandy deserts, the strongest values of roughness (red) are associated with areas of relief or surfaces with vegetation